Making Tableau work with dbt™️

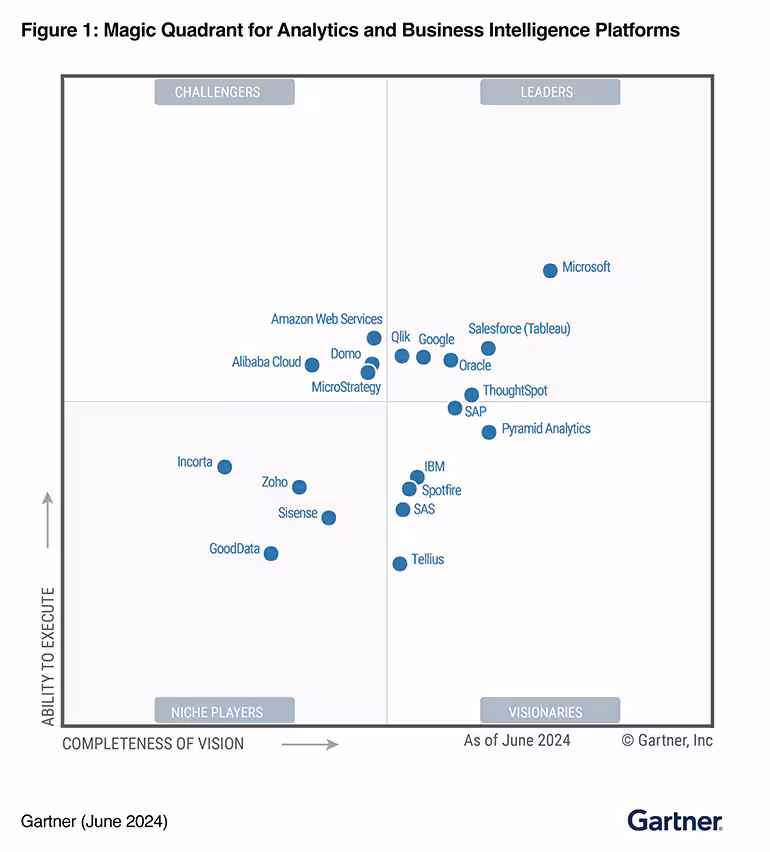
Launched publicly in 2003, Tableau was one of the major players in the BI 2.0 movement of the early 2000s. Despite its age, as of 2024, Tableau is still ranked second in BI market share and has been recognized by Gartner as a leader in the market for 12 consecutive years.
This is not easy to do. Especially in a highly saturated data tooling market that is constantly evolving (at an ever-increasing pace). Tableau has managed this feat because of its user-friendly interface, top-notch data visualization options, flexibility to conduct deep-dive analysis, and support for combining various data sources easily.
With all of these market-defining features, Tableau has remained a favorite tool for data analysts and visualization experts around the world for two full decades (just check out the Tableau Viz Gallery to see the work of some die-hard users creating some truly beautiful data visualizations).
But even with all of this success, companies using Tableau often find themselves battling with the difficulties of balancing freedom of analysis with governance of business logic.
Sacrificing governance for freedom
If you’ve used Tableau before, you’re likely familiar with its challenges with governance. As a long-time user of Tableau myself, I can vividly remember the nightmare of accidentally breaking a nested metric calculation–and the hours that would follow trying to debug where things went wrong.
Like most BI tools, Tableau guides users to create and store business logic in their Tableau data model (the BI layer). This allows users to rapidly build and iterate on metrics definitions directly in Tableau through a user-friendly interface, quickly visualizing them to sanity check and make adjustments in response to changes in the business. For Data Analysts, this supports the desired workflow of innovation and validation of metrics for the business. Typically, with a small data team and few Tableau assets this doesn’t cause too many headaches.
Problems quickly begin to arise, however, when data teams have multiple roles (i.e. Data Engineers or Analytics Engineers) or a growing number of data and analysis use cases. Metrics and calculations stored in Tableau are not easily version-controlled, peer-reviewed, or reused, making governance a big challenge. Even with transformation support from tools like Tableau Prep, this gap can result in common data quality and governance issues like duplicate or conflicting metrics, incorrect calculations, and low-quality reports and dashboards. These problems become ever more pressing as data teams and their products try to scale without clear governance of their metrics layer. Before long, it becomes very difficult for the business to trust the contents of the Tableau project.
Shifting left: dbt helps enforce data governance
Enter dbt (data build tool)–first released back in 2016 by dbt Labs (at the time, Fishtown Analytics). Since its launch, dbt has contributed massively to the data and analytics space, providing data teams with a highly governed transformation layer and the ability to work more like software engineers. Leveraging concepts like version control, modularity, quality assurance, and treating analytics code as a valuable business asset, dbt began to provide tangible ways to apply these concepts to data team workflows.
As of 2024, over 30,000 data teams all over the world are embracing the great benefits that dbt has brought to the transformation layer and beyond. This level of governance and robustness for data pipelines has enabled data teams large and small to reap the benefits of treating analytics code as an asset. It has enabled the new role and function of Analytics Engineering to explode in popularity.
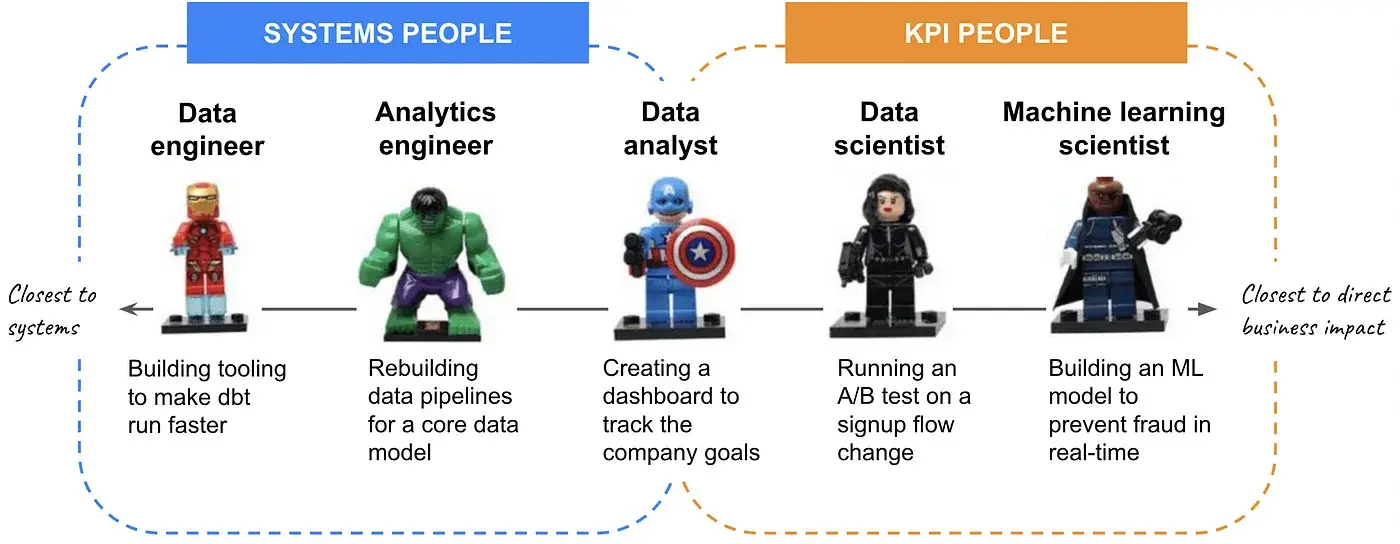
For modern data teams with a mix of systems-focused roles (Data Engineers and Analytics Engineers) and KPI-focused roles (Data and Business Analysts), this has decoupled the work of the data modeling and transformation layer from the more traditional business logic functions. Data Analysts are now the consumers or downstream users of the work that Data and Analytics Engineers provide.
This provides many benefits, with the main ones being more robust control over data governance and enforcement of data quality. The centralization of business logic into the dbt transformation layer, versus the traditional BI layer, means that things can be easily version controlled, reviewed, and tested in a CI/CD process.
And while dbt generates many upsides for data teams, it creates new challenges for streamlining the workflows and objectives of the two roles, which are seemingly at odds. Data Analysts managing the BI layer–who need the flexibility to move fast and break things, iterate and test, and quickly respond to changes in the business; versus Analytics Engineers managing the transformation layer–who want to govern, document, and test their code rigorously to apply software engineering best practices and maintain high-quality data pipelines and transformations.
Oftentimes, Analytics Engineers become a bottleneck for Data Analysts, slowing down their ability to freely experiment and iterate. At the same time, Data Analysts become cowboys of the ‘Data Wild Wild West’–sacrificing governance and data quality to uncover new insights and opportunities for the business. These inherently competing priorities can create friction and slow down the analytics development process.
dbt + Tableau: with new opportunities, comes new challenges
On top of these challenges, the Analytics Engineering workflow also suffers from inherent inefficiencies when pushing data models into the BI layer. As with most BI tools, Analytics Engineers working with Tableau will undoubtedly find themselves doing duplicate work: 1) first by building a data model in dbt and then 2) second by having to recreate the same logic with the appropriate data sources, tables, metrics, and dimensions to make them available in Tableau. This duplication of effort becomes time-consuming and redundant work for Analytics Engineers–with the promise of dbt being a “central source of truth” for transformation code, documentation, and metrics, it doesn’t entirely deliver when you can’t easily and automatically push this logic into your BI layer.
From the Data Analyst’s perspective, working directly in Tableau they are most likely responsible for maintaining the semantic and metrics definitions. When existing business logic requires changes or new logic needs to be added to dbt, they need to raise a ticket and wait for Analytics Engineering resources to be available. On a smaller team, Data Analysts may be required to open a PR themselves to add their new logic to dbt. This creates additional workflow steps that are prone to errors and miscommunications. Overall, this is poor DataOps and UX for data team workflows.
So, why not migrate to a newer BI tool that offers more built-in governance capabilities (e.g. tools like Looker or Omni)? For many companies, their use of Tableau is so deeply ingrained that migration to a new tool is not a feasible option. In addition, Tableau is still the top choice for many Data Analysts and all of their market-defining features mentioned earlier, while most “modern” BI tools are still lagging behind. For many data teams using Tableau, successful integration with dbt is critical for the data development workflow.
Enabling freedom + governance with Euno
With Euno, the competing priorities of freedom and governance don’t have to be on opposite ends of the spectrum. Euno’s features enable both Analytics Engineers and Data Analysts to prioritize their unique workflow objectives while still easily and seamlessly working together. This allows data teams to balance freedom and robust governance while boosting overall data team productivity.
With end-to-end lineage mapping and governance metrics, Euno helps data teams understand which metrics and models are being used to ensure they’re well documented–allowing governance to become a metrics-driven exercise.
Euno helps Analytics Engineers build the Semantic Layer in dbt with minimal lift, allowing them to “shift left” any metrics that have been tested, validated, and deemed significant to the business. These semantics can be easily pushed back into dbt and moved through a code review process to be governed–all without slowing down the Data Analysts’ workflow.
In addition, Analytics Engineers can easily update their BI layer with data models they have created, propagating metrics, dimensions, and descriptions to avoid the duplication of work that eats up so much BI development time with redundant actions.
Overall, Euno helps Analysts and Engineers work better together, without sacrificing their objectives or leaving their workflows. This results in an overall productivity boost and a reduction of wasted resources. For the first time, data teams don’t have to choose whether to prioritize freedom or governance. Now, you can have both.
***
Learn more about making dbt work with Tableau using Euno!